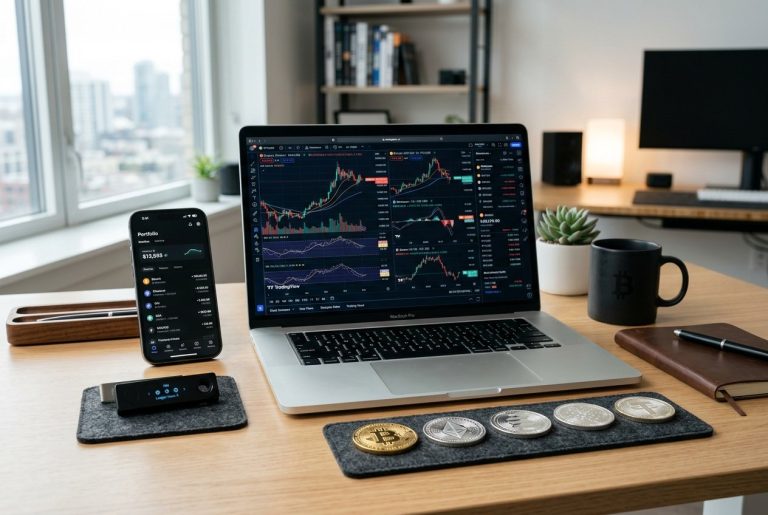
TradingView is hands down one of the go-to platforms for anyone dabbling in crypto trading. People use it to keep up with prices, stare at charts, and try to figure out when to jump in or bail out of digital assets.
TradingView brings together real-time crypto data and a bunch of charting tools, which honestly makes life a lot easier for everyone—whether you’re just starting out or you’ve been in crypto for years.

The platform does more than just show price changes. There are hundreds of technical indicators, drawing tools, and you can even code up your own trading strategies if you’re into that.
TradingView lets you connect directly to exchanges, so you can analyze and trade without bouncing between tabs.
If you’re new to crypto or already a pro, figuring out how to use TradingView’s tools can give your trading a real edge. There’s also a huge community—over 30 million traders and investors—sharing ideas, scripts, and strategies.
Key Takeaways
- TradingView offers a deep toolkit for crypto charting and analysis
- You can hook up your exchange account to trade and analyze in one spot
- There are automated scripting features and a massive community for sharing strategies
Overview of TradingView for Crypto
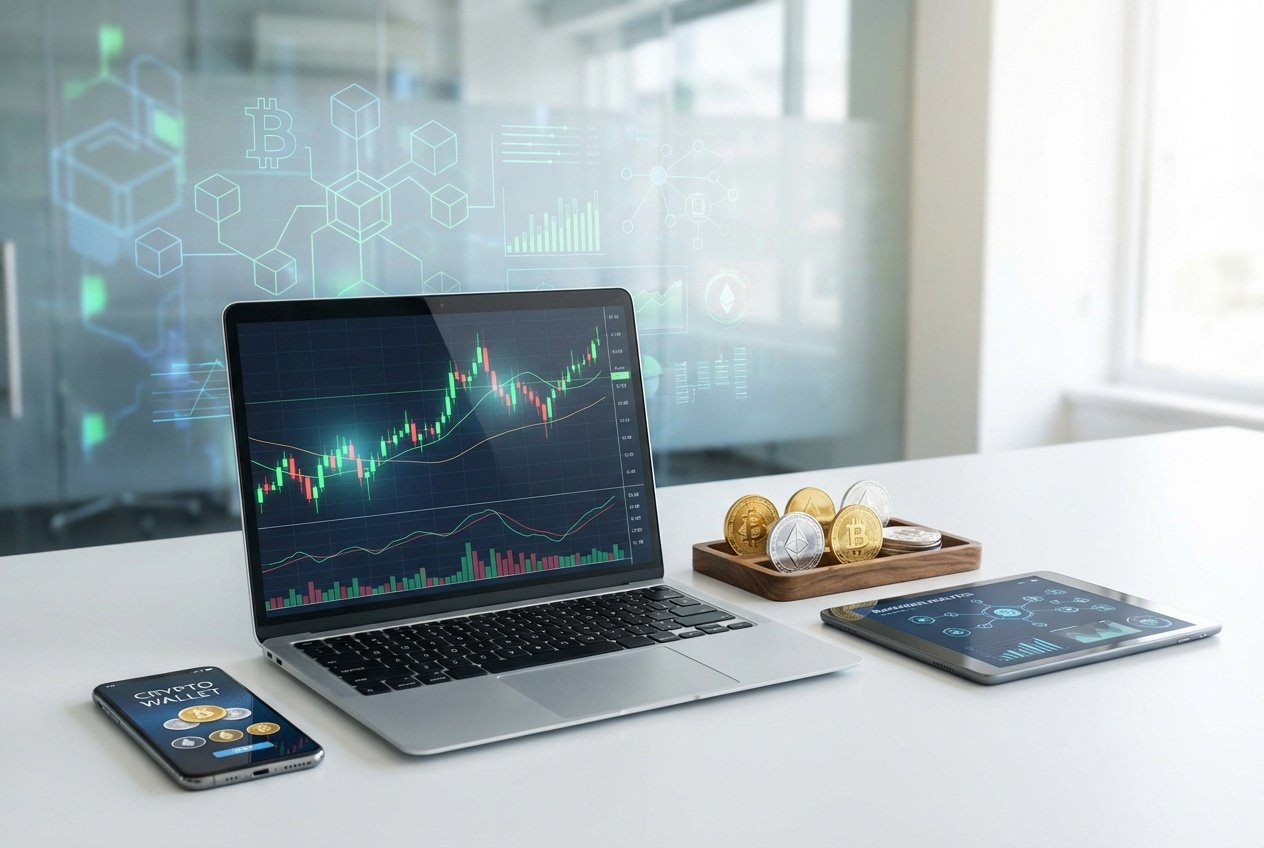
TradingView gives you real-time data from more than 70 crypto exchanges. You get advanced charting tools and technical indicators built for digital assets.
The platform mixes analysis features with a pretty active community, which can help you make smarter decisions—or at least not feel alone in the wild world of crypto.
Key Features for Crypto Traders
TradingView has comprehensive charting and analysis tools that let you dig into price movements. There are more than 100 technical indicators and drawing tools to spot trends and patterns.
You can use candlestick charts to see price action over any timeframe you want, from a single minute to a whole month. That flexibility works for both quick scalps and long-term holds.
There are price alerts so you don’t have to stare at charts all day. Set them up for different assets and get notified when something big happens.
Thanks to the social features, you can share your thoughts or trade ideas with a huge community. Post your analysis, comment on others, or just follow traders who seem to know what they’re doing.
TradingView Account Types
There are four account tiers: Basic, Essential, Plus, and Premium. The Basic plan is free, but it’s a bit limited.
With a free account, you get one chart at a time and basic indicators, but you’ll see ads and can’t save too many layouts or alerts. It’s fine for getting your feet wet.
Paid plans ditch the ads and open up more features. Essential adds extra indicators, layouts, and custom timeframes. Plus and Premium crank it up with multiple charts per tab, more alerts, and priority support.
Premium users get cool stuff like volume profile indicators, more server-side alerts, and even second-based charts. If you need advanced features, you’ll probably want to upgrade.
Supported Cryptocurrencies and Exchanges
TradingView supports over 70 exchanges, so you can track thousands of trading pairs. The big names like Binance, Coinbase, Kraken, and Bitstamp are all there.
Just search and view Bitcoin or altcoin prices in real time, across all these markets. The platform shows price differences between exchanges, so if you’re into arbitrage, that’s handy.
You can analyze both centralized and decentralized exchanges. Whether it’s spot markets, futures, or perpetual swaps, you can connect and chart them all.
Each exchange has its own pairs and liquidity. TradingView’s market overview pages make it easy to compare volumes and price action across platforms.
How to Set Up TradingView for Cryptocurrency Trading

Getting TradingView set up right means creating watchlists for your favorite coins, tweaking chart settings so things make sense at a glance, and setting up alerts so you don’t miss price moves while grabbing coffee.
Creating a Crypto Watchlist
Watchlists are a must if you want to keep an eye on multiple coins. Just log in and hit the watchlist panel on the right.
Add any crypto pair by typing its ticker, like BTC/USD for Bitcoin or ETH/USD for Ethereum. You can make separate watchlists for big coins and tiny altcoins if that’s your thing.
Watchlists show live prices, percentage changes, and volume. Drag coins around to reorder them however you like. The list updates on its own, so you can spot big moves fast.
Customizing Crypto Charts
How your charts look really matters. Click any coin in your watchlist to open its chart, then hit the settings icon at the top.
You can pick from candlestick, line, or bar charts. Candlesticks are the standard in crypto—they show open, high, low, and close for each interval. Adjust timeframes from one minute to a month, depending on your style.
Switch up color schemes to make things easier on your eyes. Most people go for dark mode with green up, red down. To add indicators like moving averages or RSI, just hit the indicators button and choose from a huge list.
Setting Price Alerts
Price alerts save you from staring at screens all day. Right-click on the chart at your target price and select “Add Alert.”
Set up alerts for price crossing a level, hitting a percentage move, or even based on indicators. Choose how you want to get notified—email, mobile, or browser pop-up.
Alerts stay active until you delete them or they go off. Most traders set alerts at key levels, round numbers, or potential breakout points. You can set multiple alerts per chart to keep tabs on lots of scenarios.
Technical Analysis Tools and Indicators
TradingView gives you hundreds of built-in indicators and drawing tools to spot price patterns, trends, and possible entry or exit points. These technical analysis essentials are all about turning price and volume data into trading signals.
Popular Crypto Indicators
Moving averages are everywhere in crypto trading. The Simple Moving Average (SMA) averages prices over a set period, while the Exponential Moving Average (EMA) puts more weight on recent prices.
Most folks use the 50-day and 200-day moving averages to spot long-term trends. The Relative Strength Index (RSI) is another favorite, measuring momentum from 0 to 100. Above 70? Maybe overbought. Below 30? Could be oversold.
The MACD (Moving Average Convergence Divergence) tracks two moving averages. If the MACD line crosses above the signal line, that’s usually a bullish sign. A cross below? Not so much.
Volume indicators like On-Balance Volume (OBV) add volume on up days and subtract it on down days, helping you figure out if buyers or sellers are in control.
Drawing Tools for Pattern Analysis
TradingView has trend lines, channels, and Fibonacci retracement tools for spotting support and resistance. Draw trend lines by connecting swing highs or lows to see where price is headed.
Rectangle and channel patterns highlight consolidation zones. Fibonacci retracements use horizontal lines at levels like 23.6%, 38.2%, 50%, 61.8%, and 78.6% to guess where price might reverse after a move.
Classic chart patterns—head and shoulders, triangles, double tops—show up all the time in crypto. They can warn you about trend reversals or help confirm a breakout.
Using Multi-Timeframe Analysis
Checking different timeframes gives you the big picture. Maybe you use the 1-hour chart for entries, but look at the daily chart to spot the main trend.
The higher timeframe shows the dominant trend. If the daily chart is bullish, look for buys on the smaller charts. This helps avoid trading against the flow.
Pro-level tools let you view multiple charts at once in split-screen. Sometimes indicators disagree between timeframes, so most traders trust the longer-term chart for strategy and use shorter ones for timing.
Scripting and Automation with Pine Script
Pine Script lets you build custom indicators and automated strategies straight inside TradingView. You can backtest your ideas on old data and set up alerts that react to market moves in real time.
Introduction to Pine Script
Pine Script is TradingView’s built-in programming language. It’s made for creating custom trading indicators and strategies, and honestly, it’s not too hard to pick up—even if you don’t have much programming experience.
Pine Script operates in the Pine Editor, which comes built right into TradingView. You write code that analyzes price data, calculates indicators, and spits out trading signals. The latest version (version 5) even lets you handle multiple timeframes, arrays, and more complex stuff if you’re feeling adventurous.
There are really just two main types of scripts: indicators and strategies. Indicators show up as visuals on your chart—think moving averages or custom oscillators. Strategies, on the other hand, include entry and exit rules you can backtest on old price data.
The typical Pine Script starts with a version declaration, then an indicator or strategy declaration, then your calculation logic. You’ll use variables for price data like close, open, high, and low. Handy built-in functions like ta.sma() for simple moving averages or ta.rsi() for RSI make things easier.
Backtesting Crypto Trading Strategies
Building crypto trading strategies in Pine Script means defining entry and exit conditions—usually based on indicators or price patterns. TradingView can automatically test your rules against historical crypto data to see how they would have performed.
For backtesting, you use the strategy() function instead of indicator(). You can set things like starting capital, order size, and commission rates to better match real trading.
The strategy.entry() and strategy.exit() functions handle simulated trades when your conditions are met.
Once you run a backtest, performance metrics pop up in the Strategy Tester tab. You’ll see stats like total return, max drawdown, profit factor, and win rate—helpful for figuring out if your idea would’ve worked in the past.
Crypto markets never sleep, so backtesting can look different than in traditional markets. It’s smart to try strategies on several timeframes, from 15-minute to daily charts. Crypto-focused strategies often work best somewhere between M15 and D1.
Automating Alerts and Signals
TradingView lets you automate with alerts that trigger when your Pine Script conditions hit. You can get notifications by email, SMS, or webhook—handy for connecting to outside trading platforms.
The alertcondition() function creates custom alerts in indicator scripts. For strategies, you can just enable alerts in the chart settings when trade signals pop up. Alerts can fire at bar close or right when the condition happens, depending on how you set it up.
Webhook URLs let you connect TradingView alerts to trading bots or exchange APIs. When an alert goes off, it sends a JSON payload with trade instructions to your endpoint. This is how you get fully automated trading, no hands required.
Honestly, it’s a good idea to test alerts with small positions first. Markets change, and what worked in backtests might act differently live. Keeping an eye on things helps make sure your automation doesn’t go off the rails.
Community and Social Features for Crypto Traders
TradingView isn’t just charts—it’s a social network for traders all over the world. Crypto traders can follow each other’s analysis, post their own ideas, and chat about what’s moving the markets.
Following Crypto Ideas and Streams
There’s a feed full of crypto trading ideas from other users. You get chart analysis, trade setups, and market predictions for Bitcoin, Ethereum, and pretty much any coin you can imagine.
You can follow traders whose style matches yours. When they post something new, you get an update in your feed. This helps you see other people’s biases, sentiments, and analysis before you jump in.
Live trading streams are a thing, too. You can watch experienced traders walk through their thought process in real time. The comments under ideas and streams make it easy to ask questions or start a discussion. You can also filter content by coin, timeframe, or trading approach to find what fits you.
Publishing Your Own Crypto Analysis
It’s easy to create and share your own chart analysis. The publishing tool gives you the same drawing tools and indicators you use on your regular charts.
Every published idea shows the trader’s past predictions and how accurate they’ve been. This makes it easier for the community to judge who’s reliable. You can add explanations, price targets, and stop-losses right on your chart.
Once you publish, your idea goes to the public feed where others can comment, react, or upvote. If your post gets popular, it’ll show up more. You can also discuss strategies or share ideas privately with specific users.
Collaborating with Other Traders
Traders can chat directly through comments or private messages. There’s a lot of back-and-forth—debating market direction, sharing alternative views, or pointing out patterns others missed.
You can build watch lists and share them with friends or groups. This makes it easier for teams to track the same coins and stay on the same page. The community shares ideas, scripts, and feedback that can really help you improve.
There are tons of custom Pine Script indicators made by other users. You don’t need to know how to code to use them. This kind of collaboration is a big deal in crypto, where community matters more than in traditional finance.
Frequently Asked Questions
TradingView does have a free plan with real-time crypto data and basic charting. Paid plans add more indicators and alerts. The platform works with multiple crypto brokers and has mobile apps for trading on the go.
How can one access free TradingView features for cryptocurrency analysis?
TradingView’s free plan gives you real-time crypto data, basic charts, and three indicators per chart. It’s more than enough for beginners to start analyzing crypto without paying a dime.
You can make charts, check price moves, and use basic technical tools. For most new traders, that’s plenty to get a feel for the platform and start learning.
If you need more, you can always upgrade. Paid plans add more indicators, custom alerts, and extra chart layouts for deeper analysis.
What are the top user-reviewed features of TradingView for cryptocurrency trading?
Real-time crypto data is a huge plus. Traders love having up-to-date prices across tons of exchanges and pairs.
The social trading side stands out, too. You can share your ideas and pick up tips from more experienced folks. It’s a great way for beginners to understand market patterns and get feedback.
Technical indicators and charting tools are another favorite. There are hundreds of built-ins, and you can make custom ones for your own strategies.
Broker integrations get good reviews since you can place trades right from the chart. No need to bounce between platforms when you want to execute an order.
What steps are required to log into TradingView for monitoring crypto markets?
Head to the TradingView site and hit the sign-in button in the top right. You can make an account with your email or sign in using Google, Facebook, or other accounts.
After logging in, go to the charts page to start tracking crypto markets. Your chart setups and settings save automatically for next time.
Don’t forget to verify your email. That unlocks all features and lets you post ideas or comment on others’ posts—plus, it’s good for security.
Which mobile applications are recommended for TradingView cryptocurrency charting?
TradingView has an official mobile app for both iOS and Android. You get all the same charting tools and indicators as on desktop.
The app syncs with your desktop account, so your layouts and watchlists stay the same across devices. You can get price alerts on your phone and check charts when you’re out and about.
There are touch-friendly drawing tools, too. It’s easy to zoom, pan, and mark up charts with your fingers.
What are some of the preferred crypto brokers that integrate with TradingView?
TradingView has broker integrations that let you trade directly from the platform. These partnerships connect your analysis to real trades.
Popular crypto exchanges like Coinbase, Kraken, and Binance all work with TradingView. Each one has its own features, fees, and supported coins.
Before connecting your account, check what each broker requires. Some need extra verification or have minimum deposits before you can start trading through TradingView.
How does the TradingView crypto screener help in identifying market opportunities?
The crypto screener digs through thousands of trading pairs, all based on whatever criteria you set. Maybe you want to spot coins with certain price patterns or sudden volume spikes—it’s all right there.
You can tweak filters for market cap, percentage change, or trading volume to really zero in on what matters to you. This sure beats clicking through endless charts by hand.
It updates in real-time, so you’re always seeing the latest market moves. If you find a setup you like, you can save your screener settings and use them again next time—makes things a lot smoother.